
NOTE 11: What the fuck happened to wages?
This is what US price inflation looks like from 1913 to 2012 according to Bureau of Labor Statistics (BLS).

This is what the change in the standard of prices (gold) look like over the same period:

I would like to you to see what happens when I set these two measures of depreciating dollar purchasing power side-by-side

One of these measures of dollar purchasing power depreciation is lying. Can you guess which one it is?
Using gold as the standard of dollar prices, the collapse of the purchasing power of the dollar is decidedly more severe in that measure. These three charts are important because they allow us to evaluate an assertion made by Christopher J. Arthur, David Harvey and the rest of the value-form school that it does not matter what serves as money.
If this assertion is true, the value-form school should be able to tell us why gold says depreciation of the dollar since 1913 has been about 7 times as severe as the Consumer Price Index measure.
How gold and currency differ
Now, I am not an expert on this question, but I have followed the CPI-gold inflation paradox into a number of commodities. All of them basically demonstrate the same tendency. So, I did some investigation into how the CPI is constructed to see if I could figure out what was going on and which measure is valid.
Let me say this: I don’t know why gold is showing the data it is, but I do know this: Gold has long been a money commodity. Up until 1933, the dollar and gold prices of commodities track each other fairly closely. When dollar prices rose, gold prices rose; when dollar prices fell, gold prices fell. This is because Washington maintained a close peg of the dollar to a definite quantity of gold.
The first big change in this relationship occurred in 1933 when by executive order, Roosevelt devalued the dollar against gold. Where before the devaluation 20.67 dollars represented the value of one ounce of gold, after the devaluation of the dollar it took 35 dollars to represent the value of one ounce of gold. It was called “devaluation” because the value of gold represented by one dollar was reduced. After devaluation, dollars represented less value.
The next big change occurred in 1971 when Nixon unilaterally removed the United States dollar from its peg to gold entirely and let the currency float. If when Roosevelt reduced the value represented by gold from 20.67 dollars to 35 dollars was devaluation, what do you call what Nixon did?
The value-form school says nothing at all happened — gold was simply replaced by the dollar as world money. Yet, if the above chart is correct, something really did happen. Something so huge that inflation measured in dollar terms and in gold terms radically diverged and never recovered. Perhaps something changed when the dollar was detached from gold that skewed gold.
I will admit this is possible, but I sincerely doubt it.
In any case gold has been a traditional measures of the value of commodities for a long time now; while the dollar was always a mere symbolic representative for the value of gold. This, of course, changed in 1971 with the collapse of the Bretton Woods agreement. And you can see where Bretton Woods collapsed on the gold chart, because after this the dollar’s real devaluation against gold goes batshit crazy.
Like I said, I wanted to know why gold and the CPI were sending mixed signals about how rapidly the dollar was depreciating. So, I went looking for a quick and dirty primer on the CPI and how it is constructed beginning with Wikipedia. According to the Wikipedia,
“The CPI is a statistical estimate constructed using the prices of a sample of representative items whose prices are collected periodically. “
Wikipedia notes that the items covered in the index are very limited and exclude a lot of costs people actually bear. Although many people refer to the CPI as a cost of living index, the BLS itself admits that the CPI is not a true cost of living index, since it specifically excludes most of the costs we pay to live.
“The CPI frequently is called a cost-of-living index, but it differs in important ways from a complete cost-of-living measure. A cost-of-living index would measure changes over time in the amount that consumers need to spend to reach a certain utility level or standard of living.”
So what is missing? Interestingly enough, the CPI excludes the cost of the state itself; the costs you bear, directly and indirectly, in supporting the state in various ways. Nothing in the CPI provides any measure of the costs society bears arising from the state sector, although it accounts for about half of the economy.
The Consumer Price Index doesn’t really measure price inflation
So, the first big problem is that the CPI begins by throwing out half of the economy based on the argument no one can agree how to value the “services” provided by the state. Of course, among these services are the hundreds of military bases the US maintains around the planet and several ongoing wars.
Now think about that: service members have to be supported by you but produce nothing of value in return. Add to this the operation of the various fleets and the dense network of military bases encircling the globe. You pay for this, but its massive cost is not in any way captured by the CPI.
But there is another problem with the CPI that is just a important as this one: The CPI doesn’t measure value, it measures utility. According to the BLS, the CPI measures “changes over time in the amount that consumers need to spend to reach a certain utility level or standard of living.”
Here is the problem with that: fiat dollars have no value and the goods bought by the dollars are not treated as values either. If the dollar is actually depreciating in purchasing power, against what is this depreciation being measured?
If you answered, “It’s being measured against the cost of goods in dollars.”, you are wrong. Washington’s CPI does not actually care about goods; it cares about something it calls utility — whatever that is. It is true that the price of a steak may increase, but Washington doesn’t care about this increase, it cares about “meat utility”. The “utility” provided by steak can be filled just as readily by hamburger or chicken. In terms of pure protein, the utility of the steak can even be filled by a can of beans.
So what does this mean?
If the price of steak soars out of the reach of most families, Washington simply does what those families do: they switch to a cheaper alternative foodstuff. The BLS can do this, they argue, because this is what the proletarians whose consumer spending they are tracking do when prices rise. Thus, the CPI does not measure how the prices of commodities are changing, it measures how your spending habits change as prices increase.
If you think about it, how can they possibly care about how prices are changing when they exclude half of the costs you actually bear? The biggest expense you have ain’t chicken or steak; it’s government. You typically spend as much on government as you spend on rent/mortgage and a car note — combined. Moreover, since 1913, government has been the single fastest growing sector of the economy by any measure — by cost, by employment, as a percentage of GDP, etc.
Think about the political implications if every year for the past 102 years, government costs showed up as far and away the fastest growing inflationary cost in the expenses of the working class? And, makes no mistake on this score, the costs of the state are easily the most inflationary item in the economy — which is why you will never see those costs included in the CPI.
I say all of this not to bitch about the costs of the state sector, but to make one critical point: the purchasing power of your wages are not measured by the CPI. The CPI only measures the changes in your spending habits as the purchasing power of your wages decline. When the price of steak increases, you switch to chicken and so does the CPI. Despite this fact, most of the data on wages you come across measures only the changes in your spending habits as the value of your wages fall.
The collapse of wages since 1964
Let me give you a good example: Here is the raw data on hourly wages since 1964 in chart form:

According to the BLS, between 1964 and 2015 the hourly wage rose from $2.50 to about $21.00. That is an eight-fold increase over about a 50 year period.
However, the increase in nominal wages are misleading and should not be taken at face value. (Pun not intentional.) Nominal wages do not really measure anything but the amount of paper you have in your wallet. The real question is what you can buy with this paper, i.e., your real wages, or wages after the depreciation of the paper dollars is subtracted.
According to Pew Research, when adjusted for inflation, average hourly wages have barely moved since 1964, when your grandparents had your job — or more likely, a good solid manufacturing job, not a six months unpaid internship:

Using the CPI, Pew Research found that in purchasing power your wage today is about the same as it was 50 years ago. Unfortunately for you, however, even adjusted for inflation, Pew Research is lying through their teeth about your wages compared to your grandparents. The real story is that the purchasing power of average hourly wages have collapsed over the past 50 years.
Here are average daily wages since 1964 in nominal dollars:
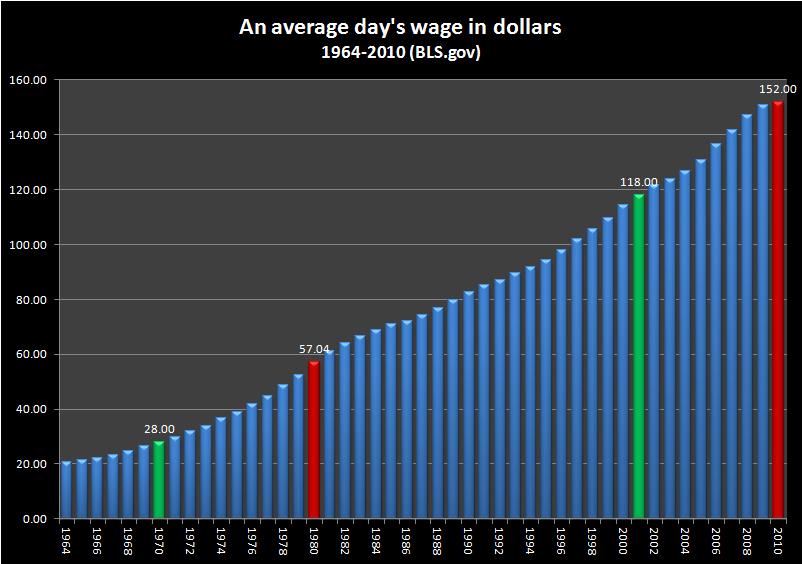
And here are those same wages measured in gold:

So, here is the story
After World War II, real wages peaked in 1970 and then began to plunge to where they are today. They never recovered in the 45 years since Nixon left the gold standard. Almost everyone accepts the government’s self-serving myth that wages have been stagnant since 1970, but this is not true — wages have collapsed. Your grandparents would have never worked for the paltry chump change you accept — if you get paid at all for your “internship”. The CPI Pew Research uses to calculate the real wage doesn’t measures inflation; it measures how spending habits have changed over the years since your grandparents worked as wages paid for labor power collapsed.
You would think Marxists would be screaming about how wages have collapse after 1970 and publishing one example after another. But you won’t hear peep out of them. This is not because they don’t care. The problem is far more horrific:
Marxists don’t even know the collapse of wages happened.
The value-form school argument that it doesn’t matter what serves as money is not just perverse and opportunistic because it ignores the exorbitant privilege Washington enjoys over other countries by having its currency serve as world reserve currency, it even ignores the devastating consequences of currency depreciation on the subsistence of the working class at home.
Still, I do not want people to think I blame the value-form school for this failure. The failure of Marxists actually long predates that theory. The value-form school did not cause this shocking failure of Marxist analysis, it is the most systematic theoretical expression of that failure.

Yes, the CPI is not a measure of value, but of use-value. The government officials who compile the CPI have to include all sorts of “hedonic adjustments” to subjectively determine how many, for example, radios a flat-screen TV is worth. (There weren’t flatscreen TVs in the 1930s, so there is no way to compare the cost of flatscreen TVs now to then. So a proximate good must be chosen for a completely subjective extrapolation).
Let’s say a person could buy 10 radios with a month’s wages back in 1930, and a person can today buy 1 flatscreen TV with a month’s wages now. Let’s say a radio provides “1 util” of enjoyment.
If the government officials subjectively judge that a flatscreen TV is 100 times as “awesome” as a radio was, then that makes the economy look really good—whereas before we could buy “10 utils” on a month’s wages, now we can buy “100 utils” on a month’s wages!
But what if a government official (or any consumer) were to come along and say, “You know, flatscreen TVs are nice and all, but are they really 100 times better? I think they are only 5 times better than having a radio.” Then suddenly it looks like the economy has dropped by half. Whereas then you could buy “10 utils” with a month’s wages, now you can only buy “5 utils.”
I keep putting quotation marks around “utils” because they are an imaginary aid for thought experiments and nothing more. They are entirely subjective. Just as 300 million Americans would have 300 million different subjective evaluations of the pros and cons of radios and televisions, so should we also have 300 million different estimates of “real GDP,” if we are going to follow the CPI method. It’s absurd!
Measuring things against gold, on the other hand, is a way of measuring things against objective value. Gold doesn’t lie. The evolutions of the gold prices of commodities tell us two things:
1. Workers are paid drastically less in gold now than they used to be. Either gold now requires waaaay more socially-necessary labor time for its extraction, such that it can represent more SNLT in each ounce, or (more likely) gold requires about the same amount of SNLT to produce it as it ever did, and people are getting paid for much less labor time (even though they still work as many hours as they ever did…which means many more hours are being skimmed off the top as surplus value).
2. Consumer use-values (consumer goods) now cost drastically less gold to purchase. Once again, either gold now requires waaaay more socially-necessary labor time for its extraction, such that it can represent more SNLT in each ounce, or (more likely) gold requires about the same amount of SNLT to produce it as it ever did, and consumer use-values take much less SNLT to produce now than previously due to productivity increases.
Lucky for capitalism that there have been these productivity increases! Because, without those productivity increases, items would cost just the same amount in gold, while people got paid less in gold. Or, equivalently, items would cost far, far more in inflated currency tokens while people merely kept their wages stable in the inflated currency. And people would notice.
The thing is, productivity increases require real investment. They don’t just happen through magic. And right now, the real investment in productive capital (factories, automation, etc.) is not happening at nearly the rate that it needs to. If this continues, then the gold prices of consumer goods will halt their gradual descent, and it will become very very obvious to workers that their declining gold wages are buying fewer and fewer consumer goods, regardless of whatever the official CPI statistics say.
One lesson that workers should get into their heads is, capitalism “should” produce deflation in the price of consumer goods—IF capitalism is doing its “job,” performing its historical mission of enhancing the productivity of the means of production. It SHOULD require less and less socially-necessary labor time to produce stuff. And, in a simple world (a gold standard world) where our currency actually reflected SNLT, the prices of goods SHOULD be dropping all the time. And workers should AT LEAST be defending their wages as measured in that same stable currency (or even occasionally fighting for increases in wages, as measured in that stable currency), thus ensuring them a better standard of living for themselves over time.
LikeLike
This is fascinating I hope you produce an article on this subject someday. Few folks realize what a fiction the CPI is.
LikeLike
When talking about value given to workers in the form of wages, you compare the money wage to gold. Based on this, you say the wage has declined massively.
What about comparing that money wage to the cost of steak and such, while also looking at how much labour goes into the production of steak (and whatever other commodities you choose to measure).
Finally, compare this to the price of gold.
Idk what the results would be, and I’ll probably look up some of that tonight. It seems to me, though, that this would give a more direct comparison of surplus value produced by workers and appropriated by the employers and state.
Is there a reason you don’t do this?
LikeLike
Your suggestion makes sense with several caveats. The roles cannot be reversed between the relative and equivalent forms in labor theory.
Thus We can say: one steak = 1/50 troy ounce of gold, but we cannot say 1/50 troy ounce of gold = one steak.
The general rule is: the steak (or any ordinary commodity) will always be on the relative side and the money on the equivalent side.
The second caveat is that money has no price. Thus, the price of an ounce of gold is actually the quantity of fiat that symbolically represent the value of an ounce of gold. In a floating system as we have today, the price standard simply is not fixed. This, however, does not mean it doesn’t exist.
Using these two rules, it is possible to produce a comprehensive list of commodities and track their movements over time. I have tried this with a few: median home price, wages, and a few others.
LikeLike