 Nicolas D Villarreal maintains a blog, Pre-History of an Encounter over at Substack. I subscribe to his blog and try to catch his new posts on economic subjects. In December, he updated his research on the secular Rate of profit.
About the same time as Nicholas was publishing his work on the secular rate of profit, I was publishing a blog post, “Rate versus Mass”, on how the debate over the rate of profit conceals the more important fact that the mass of profits have been falling for decades, despite Bloomberg’s assertion that the rate of profit is rising to unprecedented levels.
I raised the question of whether the focus of the discussion should be on the rate of profit or its mass:
“It turns out that although the rate of profit is higher now than it has ever been in the postwar period, the mass of profits peaked some time in 2005 and then plunged until 2008. After that, the mass of profits have not recovered in the last thirteen years.
“While the rate of profit appears to have dramatically recovered according to government figures, when measured in commodity money the mass of profits realized never recovered. In value terms, the mass of profits is basically where it was in the mid-1960s — just before the 1970s depression erupted.
“Is this the reason why neoclassical economists, like Larry Summers, have been whining about stagnation?”
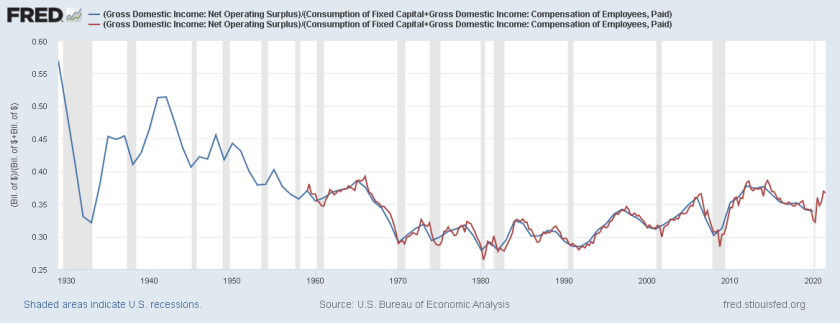
Nicholas, using methods of profit measurement that appear to differ from Bloomberg’s approach, finds that the rate of profit’s performance has been far less stellar than that mouthpiece of capital would have us believe.
According to Nicholas, from 1929 until 1980 there is a clear collapse of the rate of profit, when net operating surplus (loosely, s) is divided by consumption of fixed capital (loosely, c) plus the compensation of paid employees (loosely, v). After 1980, there is somewhat of a tepid rise in the rate of profit over three decades to a level last seen to where the rate of profit first fell in the mid-sixties.
Nicholas summarizes his research with this chart:
Where the rate of profit is going at present, no one knows; it’s all a matter of speculation.
*****
There is so much fresh material in Villarreal’s research that I thought I would subject it to critical analysis employing Marx’s definition of money, rather than the standard, dollar-currency-based method of valuation. This method uses a commodity money, gold, in place of the dollar as standard for all prices.
My method is simple: I convert all dollar currency values into actual units of physical gold for each year of data between 1929 and 2021, using either the official United States gold standard for that year or, lacking this, the inverse of the so-called average ‘market price’ of gold for that year on the London Exchange.
In 1929, the official gold standard of the dollar was 20.67 dollars to one troy ounce of gold. Each dollar, therefore, represented about 5% of one troy ounce of gold in that year.
In 2020, the so-called average market price for the year stood at approximately $1773.73 for one troy ounce of gold. The inverse of that ‘price’ means one dollar represents about 0.06% of one troy ounce of gold — a 99% decline in the exchange value represented by the dollar.
Keep this in mind for what follows.
*****
For purposes of this exercise, I used three tables from the St. Louis Federal Reserve that I believe were used by Nicholas in his research — I could be wrong about this:
- Gross Domestic Income: Net Operating Surplus (GDINOSA)
- Gross Domestic Income: Compensation of Employees, Paid (GDICOMPA)
- Consumption of Fixed Capital (GDICONSPA)
When I converted what I believe are Villarreal’s dollar-denominated data into gold commodity money data for the years 1929 to 2020, I was able to produce this chart:
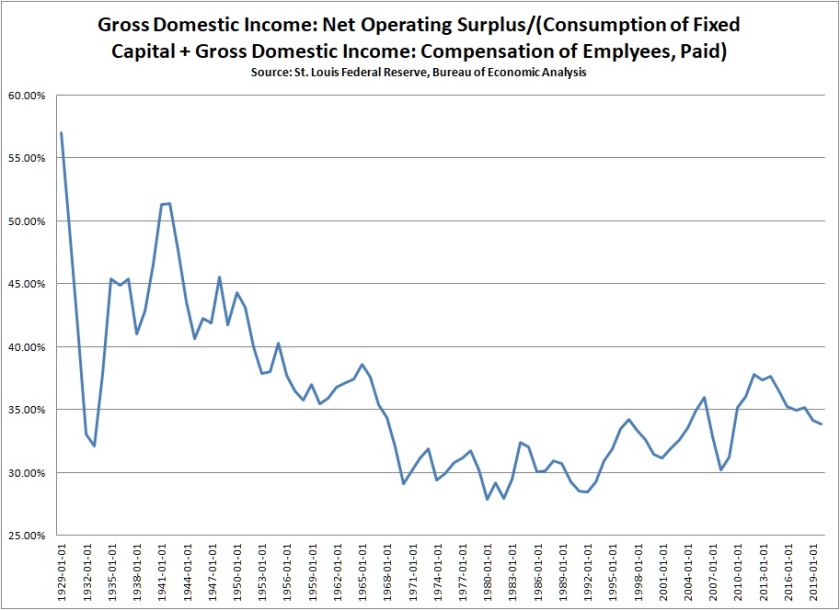
Although I don’t have access to Villarreal’s original data, and thus cannot be sure beyond all doubt that I am using the same dataset he is using, it would appear, based on my eyeball, that my chart pretty much lines up with his.
I do confine my dataset to the annual data, while Villarreal mixes both annual and quarterly data. I do this because the annual dataset that goes back to 1929, when the dollar was legally pegged to gold. This will help to establish a baseline constant dollar measure for my argument in this post.
Assuming that my data is valid, as an eyeball comparison of the two charts above suggests, what information can we derive from Villarreal’s approach?
*****
For one thing, it appears that, although very erratic from one year to the next, the rate of profit by both measures generally has been remarkably stable in the postwar period. Contrary to Villarreal, after the rebuilding of Europe and Japan, there really isn’t that much to report on the profit front.
To demonstrate this stability, I have used the original data from FRED to chart the average rate of profit for two decades in particular: the 1960s and the 2010s:
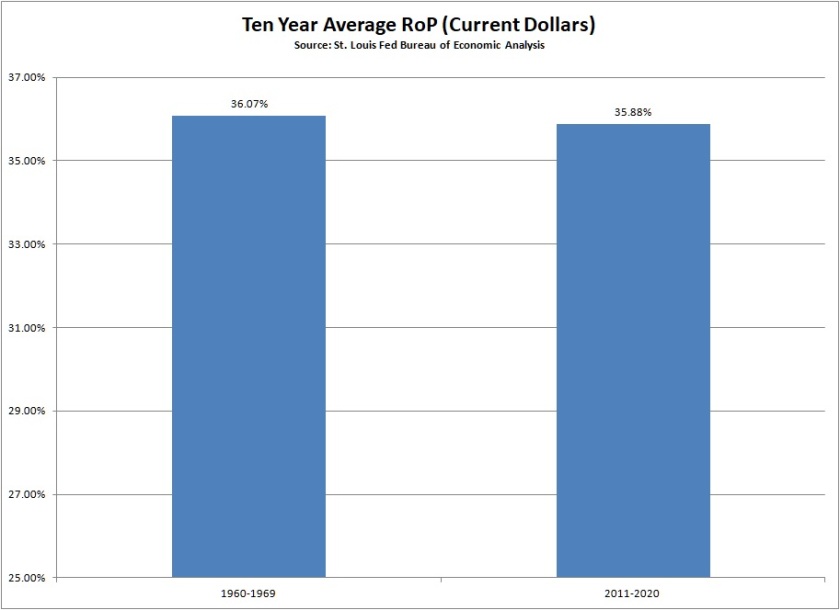
I picked these two decades for three reasons:
- They are each at opposite poles of the postwar timeline;
- for the most part, the two periods experienced no immediate economic crisis; and,
- the USD in the 1960s was pegged to gold (at 35 dollars to one troy ounce of gold), but floating against gold in the 2010s.
Admittedly, the above chart is a bit misleading in that over the two decades, the rate of profit swung rather wildly. But that is my point: year over year changes in the rate of profit tell us very little. If we expect to see a tendency toward a fall in the rate of profit, we probably should see it over a longer timeline. That tendency is not evident here.
This doesn’t mean the tendency doesn’t exist, but it does suggest it is only a tendency; other influences are at work as well.
What might surprise you, however, is that despite the two decades having almost identical average rates of profit, the annual average mass of surplus value accumulated by the United States national capital dramatically fell in the fifty years between the 1960s and the 2010s, as the chart below shows:
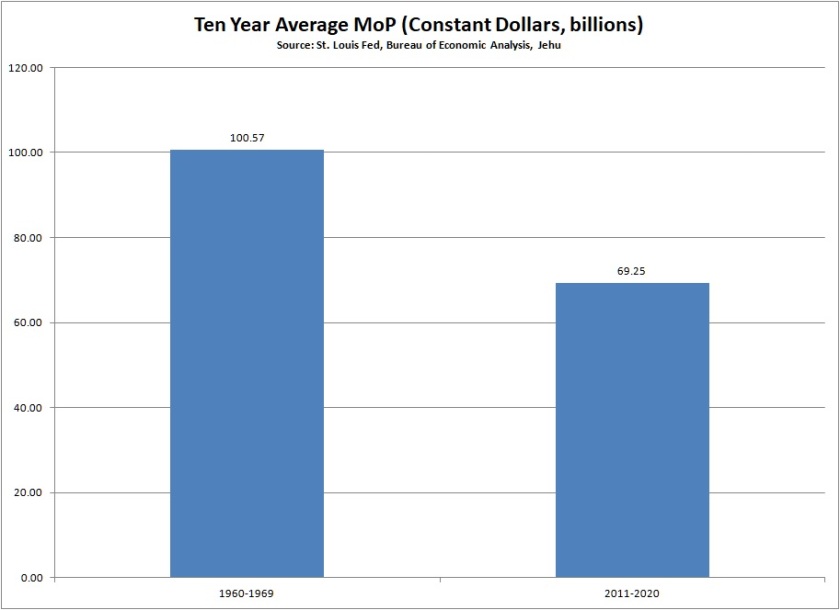
While it is true that, on average, both decades saw a rate of profit of about 36%, this rate of profit was, apparently, being extracted from a declining mass of value created during the course of the working day. The result is that, on average, the surplus value accumulated in the 2010s was 30% lower than the mass accumulated in the 1960s.
Moreover, this declining mass of surplus value has been accompanied by a steady depreciation of the purchasing power of the fiat dollar after 1971. The result of this ongoing depreciation has been to wildly inflate the mass of profits in current dollar-denominated terms, as shown in the chart below:
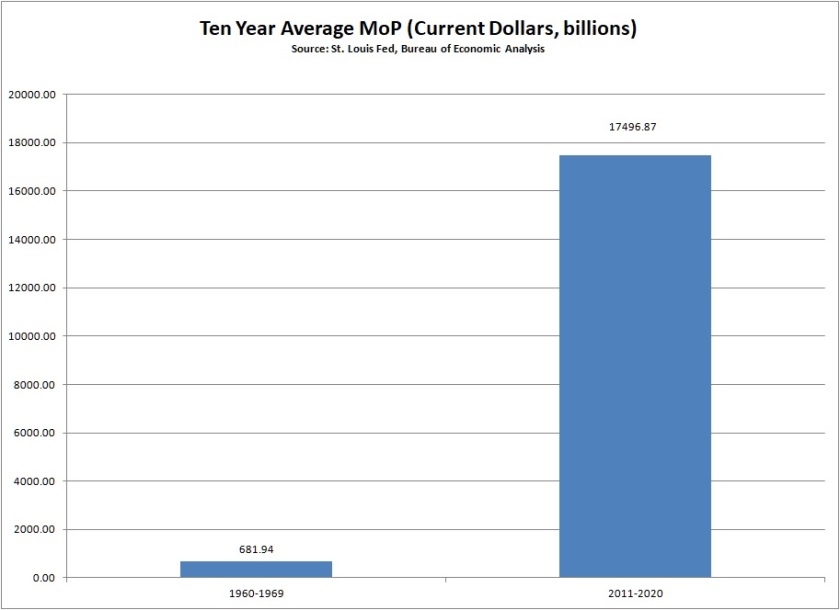
This has led to a situation where, on paper, profits appear to have swelled monstrously in dollar-denominated terms, even as they have shrunk dramatically in exchange value ( i.e., commodity-money) terms.
So what is going on here?
Are the mass of profits rising or falling?
It would appear both statements are true. Stated in fiat dollar terms, the mass of profits have swelled to gigantic proportions in the fifty years between the 1960s and the 2010s. Yet, stated in exchange value terms, the mass of profits have shrunk by at least 30% over the very same period.
So, which of these measures should we take as the real expression of the true state of the mode of production?
*****
The problem for labor theorists, stated simply, is that gold may very well express the value of commodities, but profit is always stated in fiat dollars. Capitalist don’t know what the labor value of their profits are and couldn’t care less. What they care about is that they throw a certain sum of capital, in the form of dollars, into circulation and withdraw another sum of capital — again, in the form of dollars — out.
So long as the second sum of dollars is greater than the first, they have realized a profit. No matter the alleged labor value content of the dollars, two dollars, it seems, will always have twice the exchange value content of one dollar.
Yet, for our purposes as labor theorists, things are not so simple.
Although this is poorly understood in Marxist literature, dollar prices and labor values are two distinct and separate categories. Before the Great Depression these two categories were tied together through the legal standard of price. Because the dollar was pegged to a definite unit of gold during that period, a researcher could discuss what was happening to profit in dollar terms and essentially be stating the same thing in exchange value terms.
However, since the Great Depression — and especially since 1971 — governments have been forced to abandon this legal standard by the development of the productive forces of capital itself. Now, the dollar floats against gold. On any given day, gold (exchange value) may be represented by wildly varying quantities of dollars in circulation. Add to this: fiat dollars and commodity money each behave differently in circulation. Under these circumstances, when a researcher discusses what is happening to profit in dollar terms, it is entirely possible that the situation looks completely different in exchange value terms.
Given this complicated picture of what has happened to money since the Great Depression, which measure of capitalist profit most accurately describes what is taking place within the mode of production?
*****
Why not both of them?
To explain why I think researchers need to analyze both measures of capitalist profit, let me talk about why “The World Is Running Out Of Gold Mines“.
Now, the world isn’t really running out of gold mines, but back in 2017 Forbes published an article that alleged there was a significant slowdown in discovery of new large deposits of gold.
That speculators’ rag explained the problem this way:
“Take a look at how drastically annual output has fallen in South Africa, once the world’s top gold-producing country by far. In the 1880s, it was the discovery of gold in South Africa’s prolific Witwatersrand Basin—responsible for more than 40 percent of all gold ever mined in human history, if you can believe it—that helped transform Johannesburg into one of the world’s largest and most populous cities. Today, South Africa’s economy is the most advanced and stable in Sub-Saharan Africa, all thanks to the yellow metal.
“In 1970, miners dug up more than 1,000 metric tons—an unfathomably large amount. Since then, production has steadily dropped. No longer in the top spot, South Africa produced only 167.1 tons in 2016, an 83 percent plunge from the 1970 peak. Meanwhile, miners in the notorious Mponeng mine—already the world’s deepest at 2.5 miles—continue to follow veins even deeper into the earth at greater and greater expense.”
The problem, then, isn’t that the world market is running out of new sources of gold; rather, it’s that, with all the low-hanging fruit already exploited, to get at new deposits of gold and pull these deposits out of the Earth and into circulation, requires firms remove extremely large amounts of earth in order to get at the gold buried deeper in the interior.
You can’t accomplish something like this with a pick-axe, a shovel, a pan and some elbow grease; the task today requires highly sophisticated science, machinery, and cutting edge technology to accomplish.
One source cited in article explained some of the changes coming to precious metal mining in Nevada:
“Seventy-five miles outside town, Barrick Gold Corp. is a year into the gold mining industry’s most ambitious experiment to modernize digging. At Barrick’s analytics and unified operations center, a long bank of enormous screens and rows of computers analyze data collected from thousands of sensors that record virtually all activity at and around the vast underground Cortez mine. The idea is to use Silicon Valley monitoring technology to mine more gold at cheaper rates while reducing injuries and pollution. “Literally every single aspect of the business should change,” says Executive Chairman John Thornton.
“In the past year, Barrick’s team—with help from Cisco Systems Inc.—has built Cortez’s operations center, wired the mine with underground Wi-Fi and sensors, increased its use of remote-control equipment and vehicles, and created an in-house software team called C0dem1ne. Digging costs at the subterranean 1,300-worker Cortez mine have fallen from $190 a ton to $140, and so far the team is under its $50 million budget for 2017.
…
“At Cortez, logistics changes such as rerouting trucks and reassigning miners are relayed to work crews midshift through the C0dem1ne team’s Short Interval Control app. A small fleet of underground loaders essentially runs on autopilot, continuing to work when humans can’t. Another app specifically monitors the maintenance of Cortez’s 350-ton haul trucks, each of which requires enough diesel to light a small city block. The trucks moved 125 million tons of rock at Cortez last year, and their upkeep totaled about $60 million, so avoiding the domino effects of a breakdown can save a lot of money.”
That last line — the tonnage of rock moved on essentially autonomous loaders — is the kicker. As the sheer volume of earth and rock that has to be moved grows exponentially, in order to extract a declining volume of precious metal, human labor has been replaced by increasingly sophisticated science, machinery and technology.
The total amount of rock moved increases, even as the total volume of gold extracted shrinks.
And I think this analogy can help explain what we are seeing with the two measures of the rate of profit — gold and fiat dollars. Since 1929, and especially since 1971, the extraction of surplus value has become increasingly difficult as human labor itself has been replaced by science, machinery and other technology, by what Marx referred to as the general intellect.
Today, it may take the expenditure of an exponentially growing volume of direct labor time in order to extract an ever declining mass of surplus value to maintain the rate of profit at around 36% or so.
In this relation, the dollar measure of profit may express the total volume of paid direct labor time that has to be expended given the current development of the productive forces; while the commodity-money measure of profit expresses the volume of surplus value actually extracted by this expenditure.
All of this is conjecture, of course. Except for me, no one is even doing research into the bizarre postwar anomaly of rising prices and falling values at this point. Most Marxists researchers, like Villarreal, don’t even realize the anomaly exists, or they think it is a monetary phenomenon
I appreciate the response to my work on the secular rate of profit. I’ve personally admired this blog’s writings on the working day. However, I think there’s much to critique about your view of the mass of profit. See my response here: https://nicolasdvillarreal.substack.com/p/a-response-to-jehu-on-the-mass-of?s=w
LikeLike
Thanks, Nicholas. I appreciate your thoughts.
LikeLike
It’s baffling how few published Marxists have attempted to measure recent profits in commodity money. The system of fiat currency is something of a great obfuscator: It’s unintuitive to apply labor theory when the currency is backed by financial fuckery.
Maybe you should write a book on this shit…
LikeLike
It’s not laziness on their part. That’s for sure. It must be an institutional bias against anything that challenges their preconceived notions about what is required of us at this point in history. I believe most Marxists cannot conceptually evolve beyond 1971 in their analysis. There is conceptual block that prevents them from penetrating beneath the surface of superficial economic relations.
LikeLike